| Design and Implementation of Geometric and Texture-Based Flow Visualization Techniques |

|
Usually, research related software consists of individual, isolated prototypes. Researchers are interested in a small proof-of-concept application for demonstration. Here we present software, developed for research purposes, but which has been included into a larger, commercial visualization system. We describe the design and implementation of a flow visualization subsystem within the framework of a software package capable of modeling, simulation, and visualization of CFD simulation data. Our flow visualization subsystem provides several research related geometric and texture-based visualization techniques. As a result, we are able to combine visualization options in new ways that typical research prototypes cannot. Here we describe some of our design and implementation decisions and outline the resulting advantages and disadvantages.
The CFD simulation grid of an intake port. This image illustrates the versatility of a typical, unstructured, CFD simulation grid containing a flow source from the left, two connecting pipes in the middle, two intake ports at the ends of the pipes, and a combustion chamber cylinder on the right.
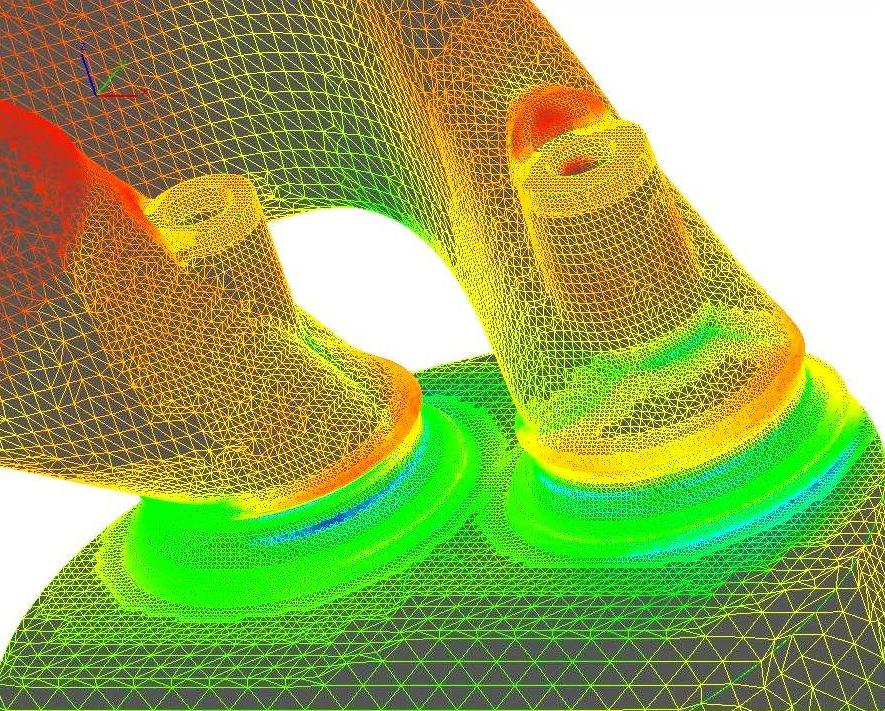
A close-up view of the intake ports in the same CFD simulation grid as shown in the previous image. The mesh contains multiple, adaptive resolution levels of unstructured grid cells.
A schematic of the design of the visualization system into which we incorporated our research related software. Note that notation follows that of Wirfs-Brock et al.
The processing pipeline for the geometric flow visualization subsystem.
The class hierarchy of streamline and geometric flow visualization options. UML notation is used to illustrate is-kind-of relationships.
The processing pipeline of the texture-based flow visualization subsystem.
The major components of the texture-based flow visualization design. Here aggregation, or is-part-of, relationships are shown.
Here we see a snapshot of a UI dialog that provides explicit support for visualization and comparative analysis of CFD simulation data. Click on the image for full resolution.
Here we see a snapshot of the drop-down menu used to select the spatial frequency of the textures used to generate the resulting imagery. Click on the image for full resolution.
Visualization of tumble motion using a combination of several visualization options including: texture-based flow visualization, isosurfacing, streamlines, and color-mapping.
A screen shot of our industry level application being used to visualize the vector field at the surface of two intake ports.
A snapshots from the visualization of a time-dependent CFD model with dynamic geometry and topology. This intake valve and piston cylinder can also be used to analyze the formation of wall film, the term used to describe the liquid buildup on surfaces. Click here to download the full MPEG animation of the dynamic mesh above.
A snapshots from the other side of the model. Click here to download the full MPEG animation of the other side of the model.